Documentation FeatureGridCreator QGIS plugin
The plugin is used to create a grid of point or polygon features for a given plot or line plot.
The plugin generates this features in a Memory layer, so you are free to save it as a file, or add more attributes to it, or to copy/paste the generated features to an excisting (saved) layer
At this moment the plugin can:
- create a grid of points or trenches within a layer or selection of polygons (plots)
- follow a (selected) line and draw points or trenches on it
- by hovering over the generated features you can give an id or label to them
More information about the possibilities you can read in the next sections.
Installation
The FeatureGridCreator plugin is available in the QGIS plugin repository.
To install, open the plugin manager, and find it by searching for ‘featuregridcreator’.
There select the “FeatureGridCreator” plugin to install it.

<== You should now have these buttons in your toolbar, and a new item in the Plugins menu.
The first button is to create a ‘grid’ of either point features ( (bore)holes) or polygon features (trenches) in a given.
The second button is to automatically give id’s or identifiers by hovering over the polygon. It is possible to give a prefix and postfix for this id’s. The id’s will fill a ‘code’ column.
Creating a Feature grid
To use the plugin, load a layer with for example plots. When you make that layer active and make a selection the plugin will only use the selected feature to fill with points/trenches. Without a selection it will fill all features in the area layer.
Note that the general idea is to generate all the features in a memory layer, and after optional rotation or giving them id’s copy/paste them to an excistion layer, or save the as a shapefile.
The features in the memory layer created will have an attribute ‘code’ which will be used in the labeling tool.
Click the left button to show the following dialog. It will only show up when you have an active line or polygon layer selected. As you can see you have different options. When using Points certain parts will be disabled.
You can set the distance in X and Y direction, and if you want them in a square or diamond arrangment.
The following dialog:
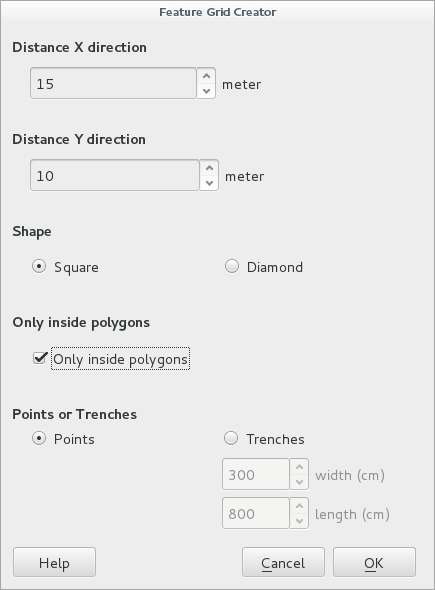
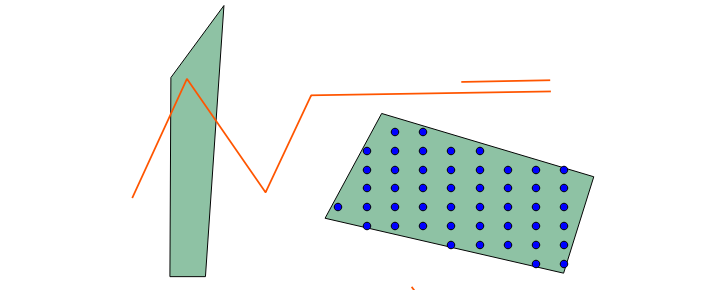
Gives you this result: only points in a SQUARE arrangment INSIDE the selected area/polygon:
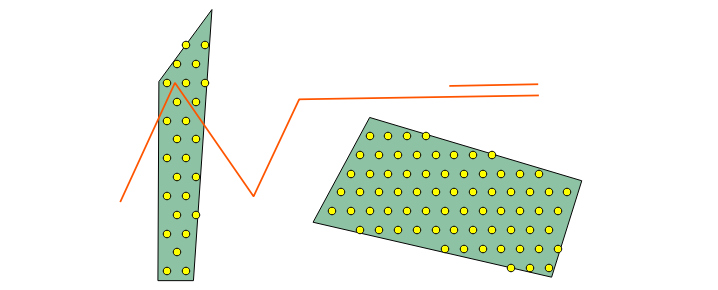
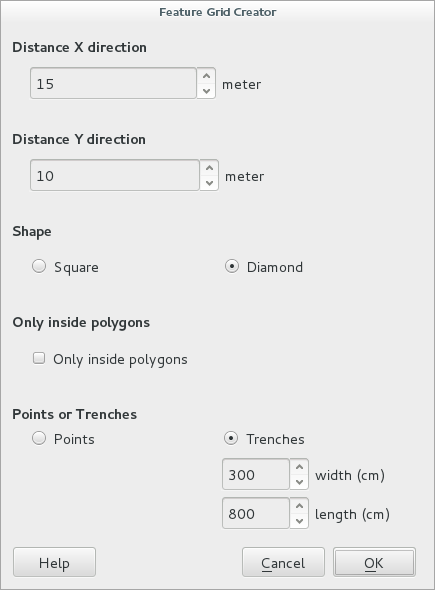
This is the result when you would have selected DIAMOND shaped, without a selection:
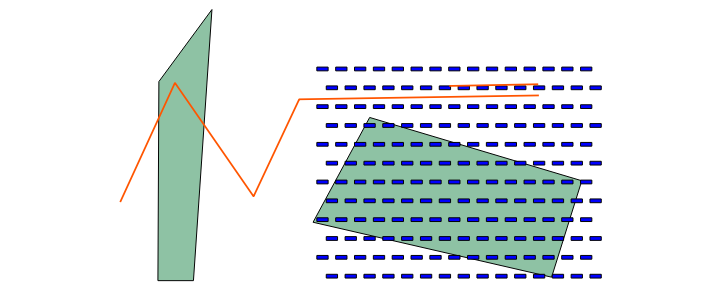
You can also select to create trenches for areas. These trenches will always be in north/south or west/east orientation.
The same rules apply as for points in areas:
This figure shows you the result after UNchecking ‘Only inside polygons’, as you can see a bounding box is created and filled with features. This works best when done with a selected plot:
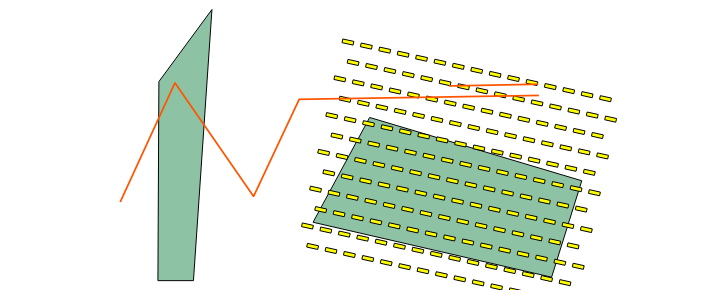
The idea is that you (after selecting all generated features) you can rotate them yourself with the default rotation tool of QGIS
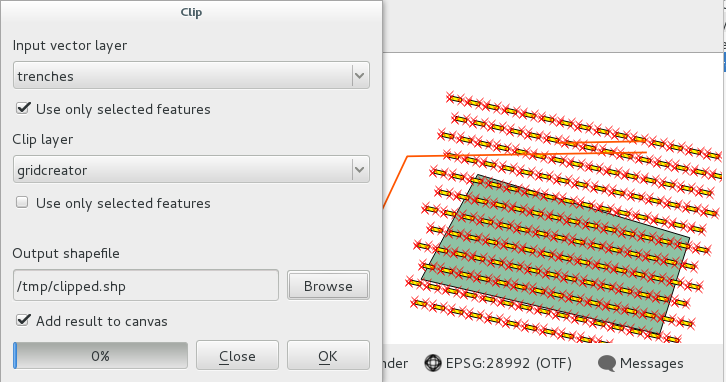
After rotation you can ‘clip’ all features OUTSIDE the plut by using the ‘Clip’ tool from QGIS: Vector / Geoprocessing Tools /Clip:
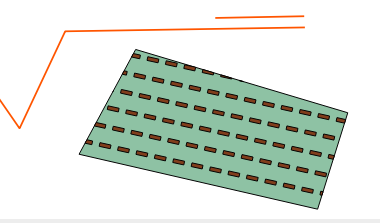
This will give you the following result.
The plugin can also work with line shaped plots. If you want to create a line of points (points or trenches) following a river, it is a good idea to create a temporarily line in another memory layer to use as the line-to-follow.
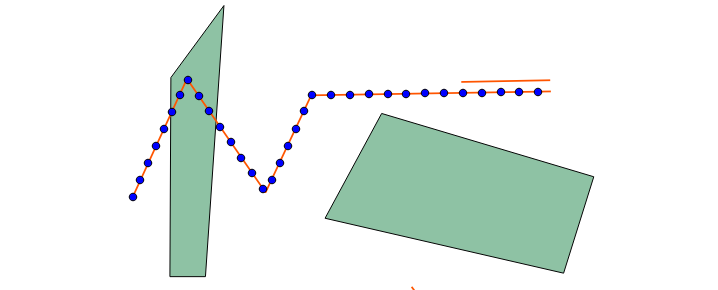
Below is an example from point following a line:
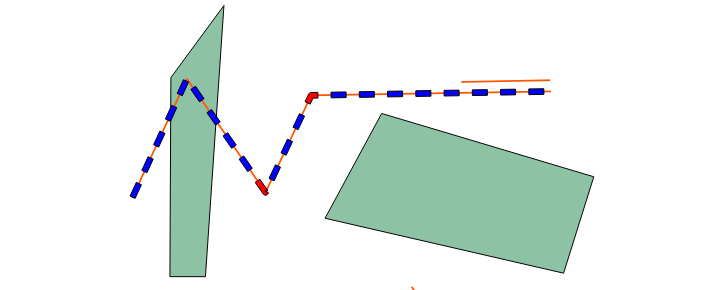
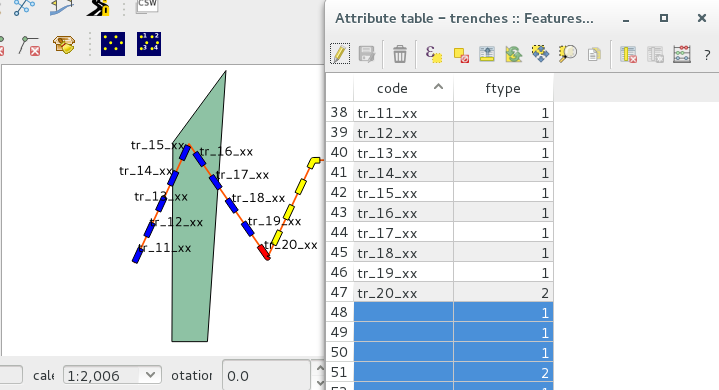
If you use trenches to follow a line, it is good to know that for example asked for 10 meter long trenches, 10 meter apart from each other, it is impossible for the plugin to create such a trench in the bend/curve of a line. Also on the end of the line it is possible that there is not enough space for a 10 meter trench anymore. To warn you for such ‘non defined’ trenches, we create two styles: a blue one for normal shapes, and a red one for trenches which are either bend, or to short:
Autolabeling
Na het aanmaken van de features, zal die laag automatisch actief zijn, en kan door op de tweede knop te klikken en over de features the bewegen automatisch labels verschijnen (genummerd vanaf 0)
After the creating of the features, it is sometimes desirable to auto-magically add codes or id’s to the features, in a order defined by YOU. For example you want all boreholes in a plot to give codes in the order as you can easily walk so to write down measurements or so.
Anyway, the second plugin button (with the little numbers in it) is used for this. Clicking that button shows you the following dialog. The button will only appear when you have a vector layer active AND a selection in it:
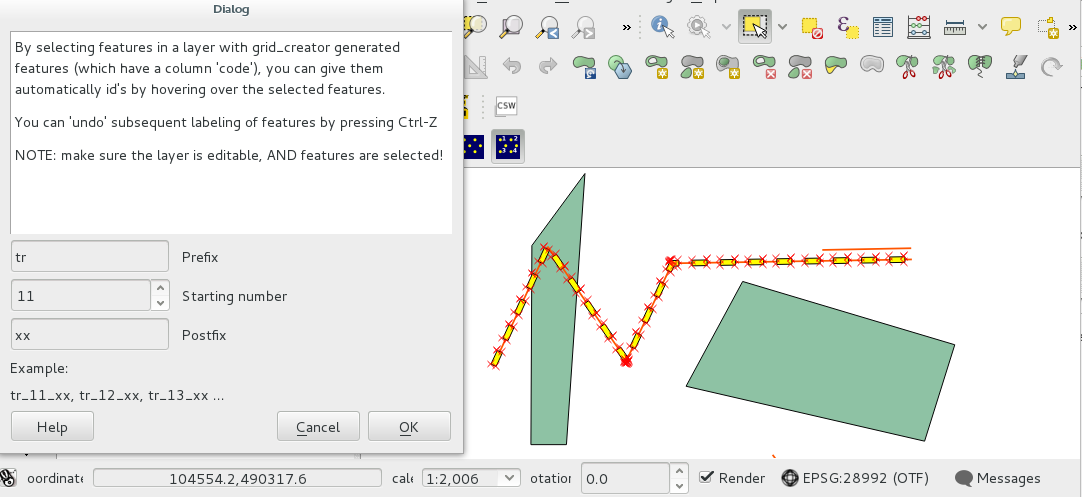
As you can see it is possible to add a pre- or postfix to the numbering. It is also possible to set the starting number.
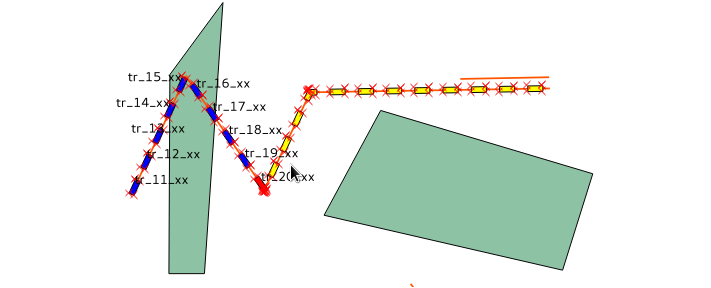
When hovering now over the selected features, the ‘code’ attribute of the features will be filled with a string which contains the prefix, number and postfix concatendated by a dash, like: tr_12_foo.
Besides the hovering the labels will be (temporarily) shown as labels in the memory layer.
IF you hovered over a wrong feature, you can go back one or more steps by clicking ‘Ctrl-z’, this will undo the last attribute and set the number sequence one value back.
If you open the attribute table you see two attributes: code (now partly filled) and ftype (feature type). The last attribute is used to denote a ‘normal’ or ‘bend trench’
Acknowledgements
This plugin is created by Richard Duivenvoorde ( http://zuidt.com ), funded by SOB Research ( http://www.sobresearch.nl ).
Code lives: https://github.com/rduivenvoorde/featuregridcreator